
Do users want Ribbons? This post about the software preferences of LibreOffice users answers this and other interesting questions and is part of the results of our extensive user research.
This article was posted first on 2011-Oct-05 at user-prompt.com (site closed now; previous postings not resurrected)
Related postings: Vol. 1, Vol. 2, Vol. 3, Motifs)
Yes, we still haven’t written about all results from our LibreOffice user research – but I promise, this will be the last of the long posts about the results.
To understand the preferences our users have when using software, we created nine questions on a six-step semantic differential. The questions are about preferences in menu navigation, workflow, individualization and the use of templates.
We found, that …
- the sample divides up in those who like ribbon style menus and those who don’t
- older people prefer classic menus while younger people go for ribbons
- younger people prefer to be actively supported by the software while older people only want
- older people more often use individual configurations and self-formatting than younger people
- people with a strong prestige motif prefer active support, to be led by assistants and they use
- people with a strong arousal motif prefer individual configurations and self-formatting
To get all the details, keep on reading!
Part 1: Menu Navigation
Structure
The first question was about menu navigation. We wanted to know whether user prefer to have:
- many menu items in fewer levels of a menu or
- less menu items in more levels.
Obviously the more functions a software has, the more menu items are there. Even with a lot of functions, the menus should still be neat and clear.
We did not find a specific pattern in the answers. Although there are some people on either extreme side, we could not find any moderating effect.
Organization aka ribbons
This next question was about preference of a ribbon style toolbar on the one side (low values) versus a classic menu and a set of toolbars on the other side (high values). Microsoft invented Ribbons as a solution to the problem above: which functions should be directly accessible?
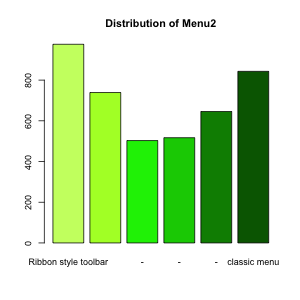
This question about the preference turns out to be of very controversy matter. People either love or hate ribbons, which is shown in the histogram.
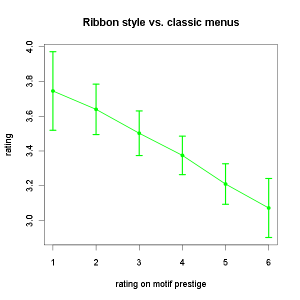
We also found that there are strong effects between this question and the rating on the motif prestige (graphic on the right). People who rate higher on prestige prefer ribbons (F(1,4176)=48.61; eta=0.601). This is an interesting result as it wasn’t expected. One possible reason could be that people, who want to be popular and admired by others also try to keep up on latest developments and to be always up to date. Are there more ideas to this?
There is an even stronger effect of the variable age on answering this question. Older people are more likely to prefer classic menus while younger people prefer ribbons (F(1,4011)=496.28; eta=0.992). As ribbons are newer inventions, they are easier to understand and handle for people, who never got too used to the classic menus. This result is consistent to the findings of other studies.

To summarize one can say that people either like or dislike ribbons. Younger people and such with high values on prestige are more likely to enjoy ribbon-like controls. On the other hand there are a lot of users that would refuse to use these ‚gimmicks‘. We think the direction of interface design taken with the invention of ribbons is good but they still need to better elaborated and understood.
Optimization
The last one of the questions about menu navigation deals with menu control. We asked about the preference to use a mouse on the one side of the semantic differential vs. a keyboard (shortcuts and keystroke combinations) to control menus on the other side. Mouse control is easier and more intuitive. Keystroke combinations are faster but harder to find out and they have to be memorized.
We did expect effects of motifs, age or expertise to take an effect on this preference statement. But again, this question turned out to be not selective for the sample. Obviously, there are people on every step between the options.
Part 2: Workflow
Assistance
The first question dealing with the preferences of handling workflows was about preferring either being led by an assistant or free editing without being led.
It shows, that there is an obvious tendency to free editing and only very few people prefer to be led by an assistant (wizard). This could be a result of the fact that people nowadays are often irritated by assistants (like „Clippy“ from Microsoft Office). They rather edit free than be annoyed by a bad assistant.
There is an effect between this question and the motif prestige (graphic on the right). People with stronger motifs for being admired aka with high prestige prefer to be led (F(1,4099)=35.82; eta=0.488). A possible reason could be that mistakes are more unlikely if you are being led by an assistant. People with greater intentions for prestige would want to avoid mistakes and show good results. Do you have another plausible idea for this result?
Access to functions
The second question was about the quantity of functions in direct access (many toolbars or no toolbars). We could not find a clear result. This does not mean people don’t care about toolbar cluttered interfaces. User interface design should carefully investigate whether or not additional toolbars should be introduced or replaced by other controls. The question probably simply could not be answered seriously by the users.
Interaction
Question three deals with the preference for a configuration via graphical elements (e.g. create a table by dragging rows and columns in a preview) or via textual dialogs (e.g. create a table by entering the number of rows and columns). Graphical dialogs look better and are more intuitive to use by mouse control. Textual dialogs are – once learned – faster by only using the keyboard and offer full functionality.
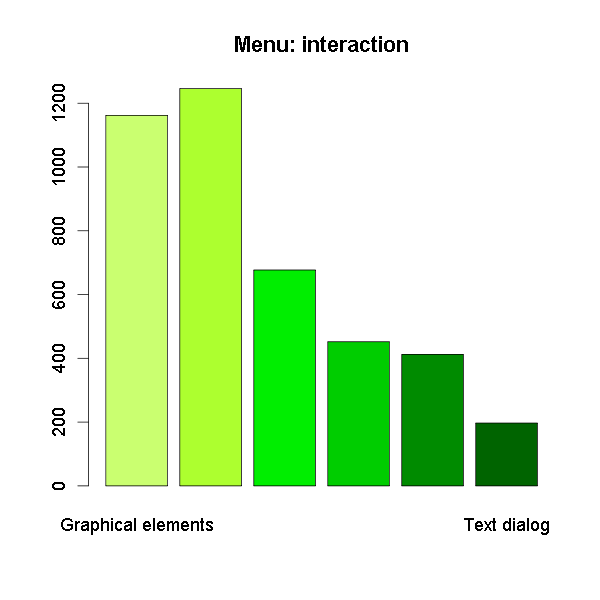
Although in most software you can configure using textual dialogs, it seems people strongly prefer graphical dialogs (as you can see in the histogram on the left). They are easier to handle than abstract digits.
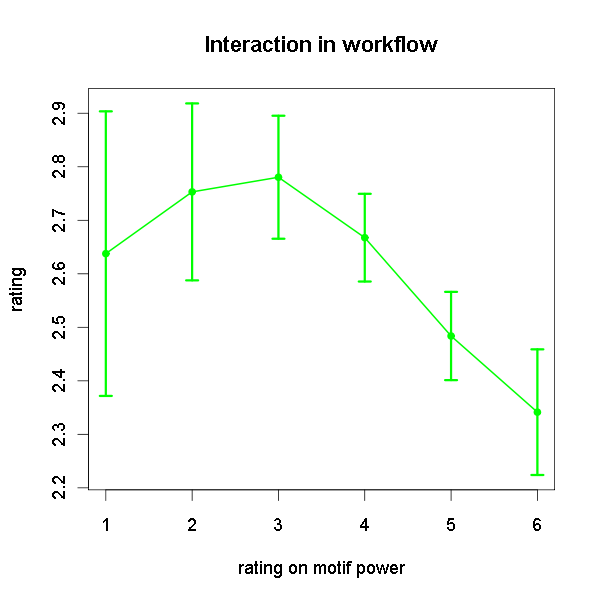
As shown in the graphs, there is a relation between this question and the motifs power and prestige. People with an average to low power motif mostly prefer textual dialogs (F(1,4098)=32.84; eta=0.456). What could be a reason for this finding?
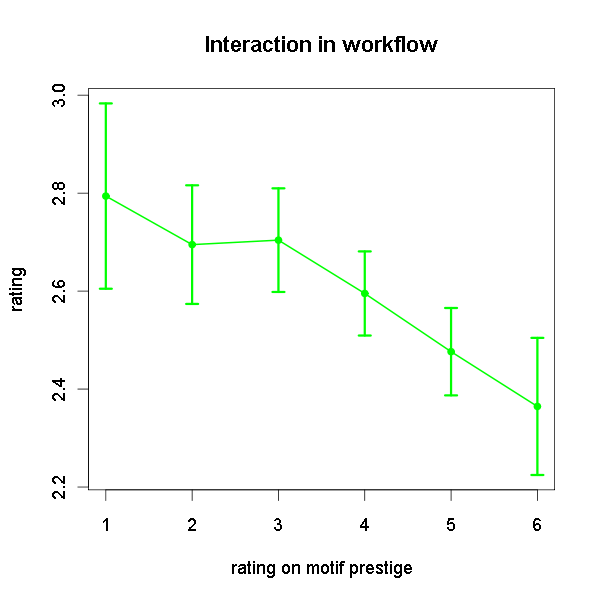
People with a higher prestige motif prefer graphical dialogs while people with a lower prestige motif prefer textual dialogs (F(1,4104)=28.33; eta=0.405). Yet again, this could be a result of the fact that the people with high prestige motif are worried about doing things wrong and therefore go for the easier solution.

A very strong relation can be found with the participant’s age. Older people significantly prefer textual dialogs. The effect is with an effect size of eta=0.742 very relevant. Could this be because older users are more used to textual dialogs? Do you have any other interpretation?
Support
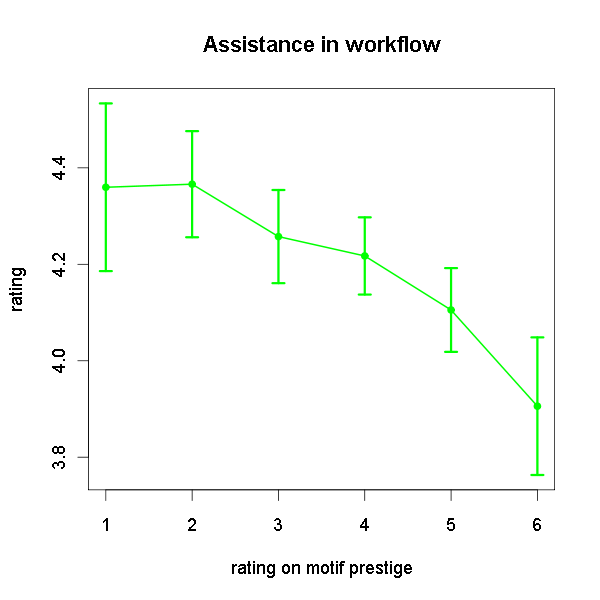
The last question to workflow was about whether one like to get active support through the software or rather only after asking for it. This question is quite close to the question above about wizards and probably reminds people again of annoying pop-ups.
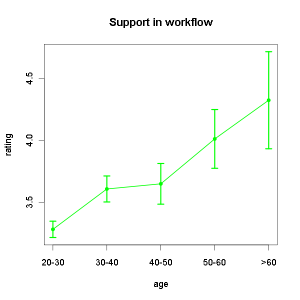
Again there is a significant effect of age on this preference. Younger people prefer to be actively supported by the software. The older the people are, the more they only want support after asking for it. The effect size of eta=0.762 highlights the relevance of this result. Can you think of a reason for this finding?
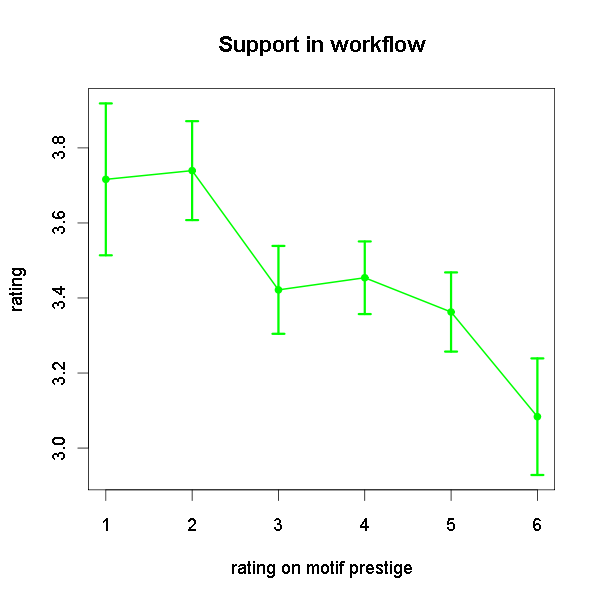
As in some other preferences before, again we find a relation between this preference and the motif prestige. People who rate higher on prestige favour active support (F(1,4108)=44.12; eta=0.567).
Part 3: Individualization
Settings
The next question was about the preferences of individualization when using software. Participants were asked to indicate whether they use the software’s default setting on the one side or configure it individually in accordance to personal preferences on the other side. We asked this question as it not only shows if we should provide more options to individualize: it also tells us something about the real expertise of our participants/users. We would expect more expert users to make more extensive use of individualisation options.
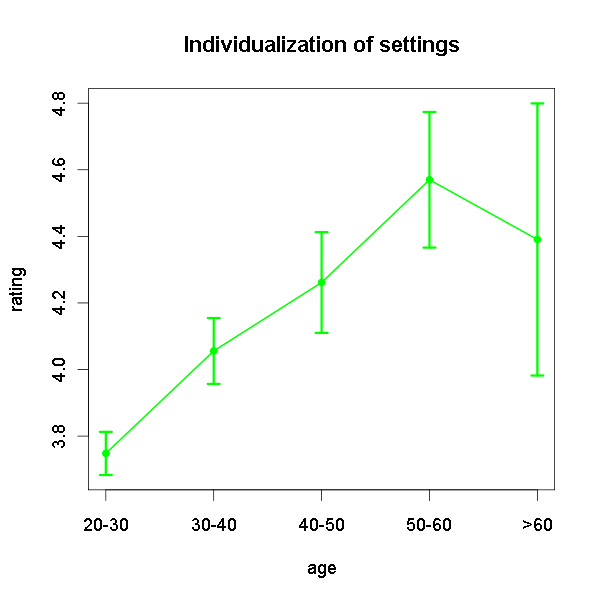
All in all, there is a tendency towards an individual configuration. Surprisingly it shows, that older people seem to be more interested in individual configuration than younger people (F(1,4027)=85.12; eta=0.802) while we also found that younger people see themselves more as experts. Perhaps younger people overrate their skills or – take it the other way around – older people have excepted the computer to be more complex than one would hope?
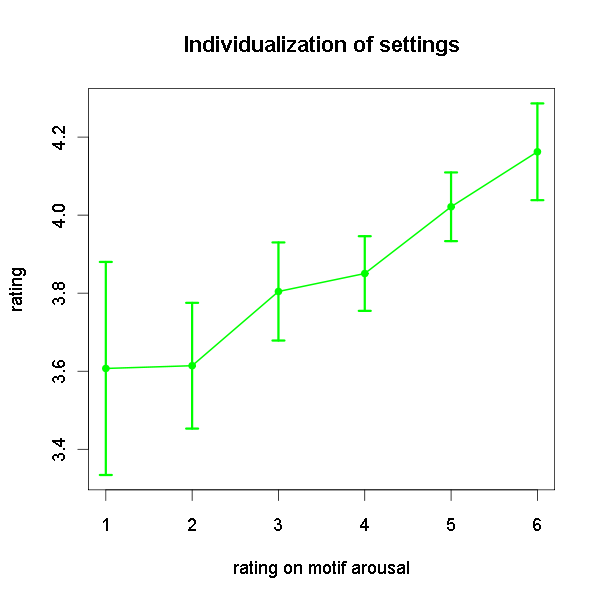
Another interesting significant effect is that people with a higher motif for arousal prefer individual configuration (F(1,4070)=45.12; eta=0.577). Obviously users needs to be a bit adventurous to dare to individualise their software.
Templates
Last but not least we asked, whether the participants prefer to use default formatting or self-created formatting. Again we would expect more advanced users to prefer self-created formatting. So, like in the question above, the answer should tell us something about the expertise of the users. But again, this question does not seem to be easy to answer.

In result it shows that older people prefer self-created formatting (see graph on the left), mostly people between 50 and 60 (F(1,4020)=74.3; eta=0.761). Did they make bad experience in the past or do the simply have a different need?
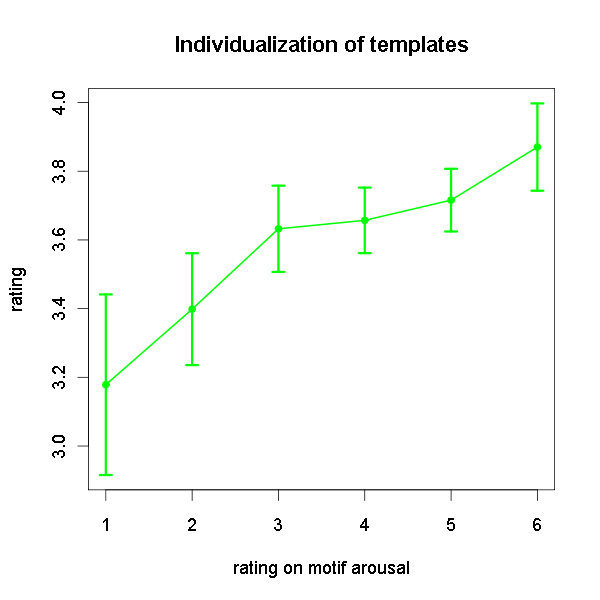
Again it shows – like in the question above – that people with high arousal motif use self-created formatting more willingly. The effect size eta=0.476 (F(1,4060)=34.45) is not overly high, but points at the effect. The reason could be the same as for individual configuration: those people like to be aroused by trying out functions of the software instead of using the same defaults again.
That’s it folks.
These are all results of our survey for now! We will soon give the long awaited management-summary of the findings – hopefully in time for the LibreOffice Conference in Paris.
So we are looking forward to exchange with you – either in person on the conference or in the comments below. Did you like what we did? What should we improve in the next survey? Are there any questions you have and we could try to answer using the data from this survey?
from 2011? 8 years ago
That’s many software releases ago, and the impact of tablet and phone screen input for WP barely established.
Needs an update..
Very interesting nonetheless.
An interesting study that would benefit from a wider participation. I am 70 and many of my students are also 50+ and beginners with IT. None of them would have responded. Perhaps the involvement of organisations such as Age UK and further education colleges would have helped.
@Richard, Alan: resurrected the old posting since it was a nice study with many participants. Back then the aim was a scientific approach to persona (generalization of user in usability) per Motifs (psychological typology approach). Would say now, it was a bit too ambitious and over-engineered, but still interesting. Some of the results are informative such as the U-shaped relation between ribbon acceptance and age (or familiarity in terms of “some people won’t digest what they haven’t seen before”). Vol. 1 holds information about participants’ age, of course a large drop-out for over 60.
Hi Heiko – thanks for the comments. As Richard said there is a changed landscape and, as Ms and Ubuntu found I believe, one “size” does not fit all. Ribbons are certainly more suited to phones and tablets – menus to computer screens and input devices. Perhaps Libraoffice would do well to provide an easily configured switch option?
I have just produced a book on LO and found it capable. The Export as PDF tool trashed the layout and graphics and I had to use Print to PDF and the Ms system worked very well. Overall, my clients and students find LO highly usable.
Our solution is the Notebookbar. While MS for sure has put much usability effort into its products, and the Ribbon is definitely a very advanced and easy to use control, it has limits regarding customization. The NB can be defined freely by the user (admittedly not very easy this time but more is coming) and you can select your preferred UI out of a number of predefined options. Learn more at https://wiki.documentfoundation.org/Design/ToolBar and https://help.libreoffice.org/6.2/en-US/text/shared/01/notebook_bar.html?&DbPAR=SHARED&System=UNIX
Happy you enjoy LibreOffice.