
More than 5400 people took part in our LibreOffice User study. The results give insights about who the users of LibreOffice are and how motifs can help to describe them.
This article was posted first on 2011-Aug-18 at user-prompt.com (site closed now; previous postings not resurrected)
Related postings: Vol. 2, Vol. 3, Vol. 4, Motifs)
Summary
As promised, this article is about the first results from the latest LibreOffice (LO) survey. To start with, we will give you an impression about the variables we raised and how they are distributed in the sample. Following on, we will tell you more about the general effects found in the survey and how that can be used to improve LibreOffice.
There will be a couple of posts in this blog dealing with this survey, starting today with a description of the independent variables. Next we will present results of motifs and thereafter such of LO usage. It’s remarkable that a huge number of people (n=5419) answered our questions in about one week, with a fairly good responder quote (~75% completed the survey). Many of them are students with a high self-estimated expertise.
Obviously our users are more than willing to bring in their experience and their wishes into the development of LibreOffice. This is an experience I also gained in many other FLOSS projects. As I discussed with Michael Meeks on the Desktop Summit, we will give LibreOffice users this chance to participate in surveys more easily in future. Read on to get an insight into the results. If you want to analyse anything yourself, we are more than happy to give you access to the data.
Aims
The aims of the study were twofold:
- First, we started usability research for LibreOffice by investigating the target group. Decisions about the direction LO is going to take, need to be based upon knowledge about our users, how they use LO and where they need more support.
- To get a more scientific groundwork into the user research work we introduced the so called „motifs“ which are well established in psychology to describe people’s goals [1,2]. Research on motifs was the second purpose of this study.
Methodology
There are independent variables and dependent variables in every survey:
- Independent variables are variables that are given and do not change when other parameters differ (e.g. your origin is fixed and does not change with your preference for keyboard combinations or mouse usage).
- Dependent variables are expected to change in relation to these independent variables.
For the present study we collected some demographic data as independent variable that could be used to divide users into groups. E.g. elder users might have a different approach to use software compared to younger. The demographic data we collected was origin, age, business, expertise in terms of computer use in hours per day, self estimated know-how, and valuation of personnel computer relevance.
As a further independent variable we also raised the participant’s basic motifs. They will be discussed in a follow-up article.
Results: Demographics
Today we present the analysis of the independent demographic variables.
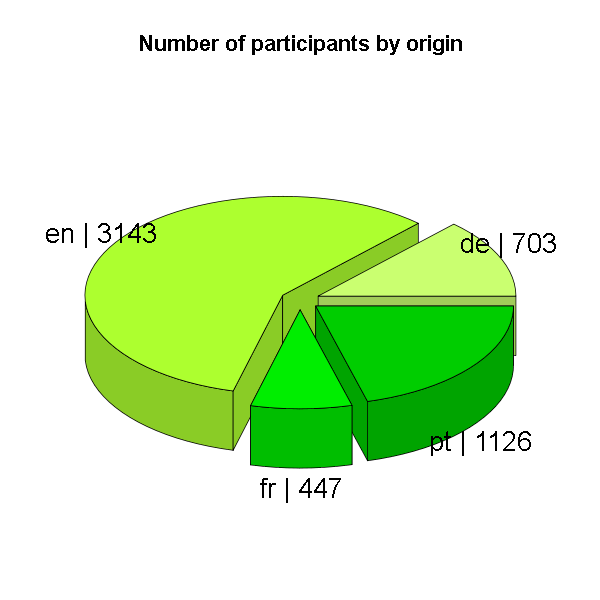
Origin
The study was translated in four languages. Most participants answered in English, second and third was Portuguese and German and the smallest group were French speaking participants. The great amount of English answers doesn’t tell us a lot about the participant’s origin though. As we had only four languages, everyone who is neither French nor German or Portuguese would have answered in English. Hopefully for the next surveys, we get a bigger range of translations. I do count on the LO translation community there!
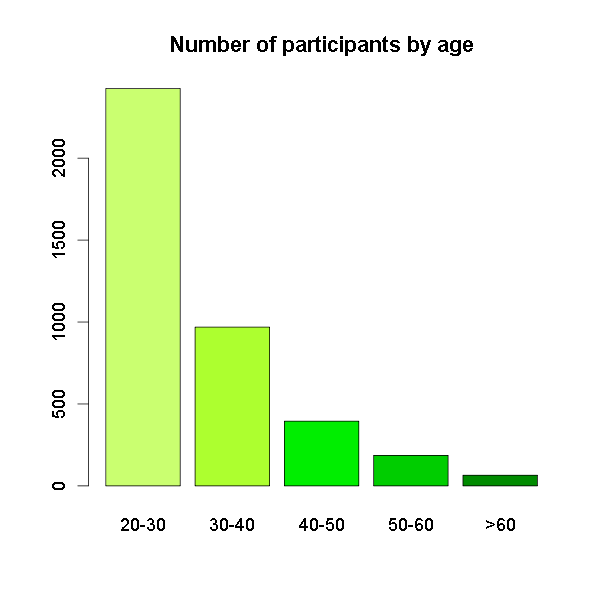
Age
Most of our participants were quite young (between 20-30). Only very little were older than 50 (7%), which is surely a result of the fact, that the survey was advertised only via social media. But maybe, we do have mainly young people amongst our users?
Business
Considering the young age of our participants, many of them are still students (27%), we also have many employees from the service sector (15%) and the IT sector (20%). Smaller groups are working in education (11%) or craft (10%). The other sectors like health, economics and right & law were much smaller represented in our sample (5-1%). Do these sectors prefer closed-source solutions?
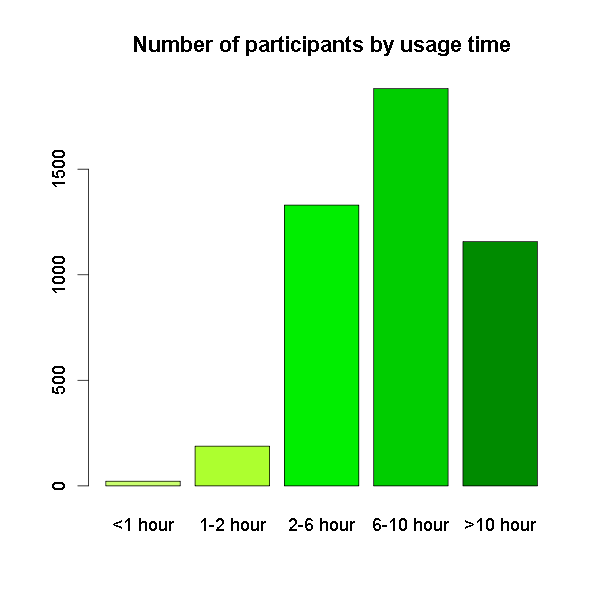
Expertise
Expertise in using a computer, experience (duration of computer usage per day) and relevance of using a computer are the three variables that we summarize as „expertise“. Unfortunately, responders did not self-estimate as newbies. The relevance of computer using is only for 1% low („unimportant“ n=8 and „rather unimportant“ n=41), but for 99% rather important (n=957) or even important (n=3554). We can see the same effect in self rated knowledge, where only 0,4% rated themselves as beginners (n=18), 23,6% as average user (n=1079), but 76% see themselves as expert in using computers (n=3470). 66% spend more than 6 hours daily on a computer, 25,3% of them even more than 10 hours.
Correlations between independent variables
One would expect no correlation between the independent variables. As you can see in the correlogram most values are low to not existent. Usage, expertise and relevance do correlate moderately due to ceiling effects. We will have to alter these questions for further surveys to avoid these artifacts.
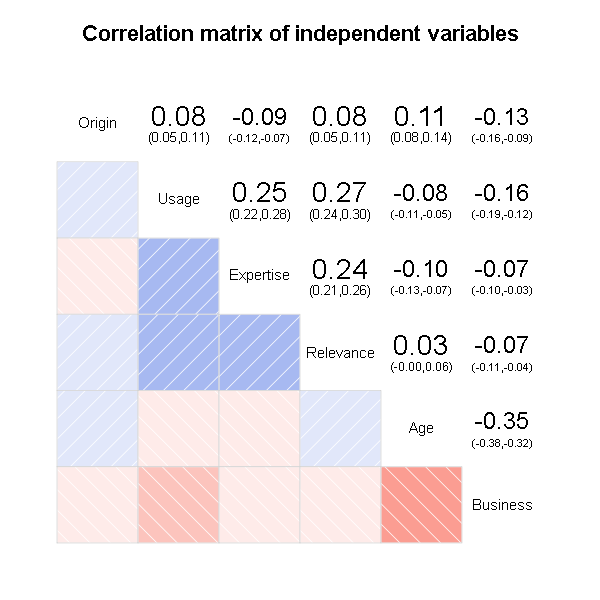
The relatively high correlation between age and business is due to the fact that the majority of responders are students less than 30 years old. A different methods of recruiting people to take part in the next surveys will help to lower this bias.
Next on LibreOffice user research: Descriptives for motifs and the relation to independent variables.
Special thanks to Isabel Menz and Heiko Tietze for fiddling around with the data and R and supporting me with this post.
References
[1]: Bischof, N. (1975). A systems approach toward the functional connections of attachment and fear. Child Development, 46(4), 801-817.
[2]: Schönbrodt, F.D., Unkelbach, S.R., Spinath, F.M. (2009). Broad Motives in Short Scales – A Questionnaire for the Zurich Model of Social Motivation. European Journal of Psychological Assessment, 25, 141-149.