
Motifs have the potential to make the creation of personas easier and more scientific. We have done some research together with the users of LibreOffice and show how to work with motifs.
This article was posted first on 2011-Aug-30 at user-prompt.com (site closed now; previous postings not resurrected)
Related postings: Vol. 1, Vol. 3, Vol.4, Motifs)
Summary
The main results show that
- motifs security and prestige decline linear with age,
- asking users for a self-estimation relevance or expertize does not work out,
- motifs can be used for characterization and description of users.
Read on to get the full details.
Motifs
A very common approach in usability is to create fictional characters to represent different user types within a targeted user group. This methodology is called Personas, promoted e.g. by Alan Cooper [1]. Thus a Persona is meant to stand for a set of users that are expected to use the product in a similar way. These Personas are usually described on dimensions like demographic, attitude, goals or behavior.
Unfortunately Personas are not scientifically proved in any way. They seem to work somehow, but are far away from the insights of the science of psychology in general or differential psychology more specifically. Differential Psychology studies the ways in which individual people differ in their behavior. At the Psychological IT-Consultancy Apliki we want to bring the findings of Psychology into the development of IT products, thus we cannot be satisfied with this situation.
We therefore apply well-established psychological approaches to the field of IT. In this study we are targeting a theory called ‚Zürcher Modell‘ by Norbert Bischof [2], better known as ‚motifs‘:
Motifs are stable personality traits that show the importance of certain goals for the person. To find out more about our users, we asked them to self-estimate themselves on the five basic motifs that are fundamental to every human being:
- Arousal is the motif of experiencing new and exciting situations.
- Prestige is the motif that describes the intention of being popular and admired by other people.
- (Social) Security is the need of being in secure relationships and not left alone.
- Achievement is the motif of being very fierce to deliver good performances.
- Power is the motif of wanting to take the lead in teams.
To put it short: motifs try to explain why people act at all. Motifs promote a constant set-actual comparison. If e.g. a person with a low set-value in social security is in a crowded situation, this person will most likely try to leave this setting. For more specific reading the book from Bischof [2] is recommended.
In this study we are collecting data on motifs to find out how motifs influence our IT preferences. This addresses questions like: Do people with a high motif for achievement have other preferences in individualization of a software than people with a lower motif for achievement?
There is a well-perceived questionnaire with 25 items for the self-assessment on the five motifs. This is obviously too long for a survey, so we decided to use only one question per motif. We chose the one that rated highest on the motif factor and we considered as most reasonable.
Relations between Motifs and independent variables
To check whether the motifs – as we raised them in the survey – are actually usable, we first set them in relation to the independent variables introduced in the last post.
First, we dichotomised the variables expertise, relevance and usage to have a sufficient number of answers for each option. As already mentioned in the last posting, e.g. for expertise, there are only few people consider themselves as beginners and average users, so we put them together in a group we call „less expertise“ and those, who consider themselves as experts make up the second group „more expertise“. We did the same for relevance and usage, where the problems were similar in order to the given answer options.
In this article the effect size ‚eta‘ will be important. Due to the large data set a lot of statistical tests reveal significance. Therefore, primary attention has to be drawn on the effect size – an indicator for the relevance or strength of an effect. Commonly, an effect is treated as medium strong if eta is above 0.3 and as high if it exceeds 0.5. We will only discuss results with an effect size over 0.5 to make sure the effects we are talking about are relevant.
Age
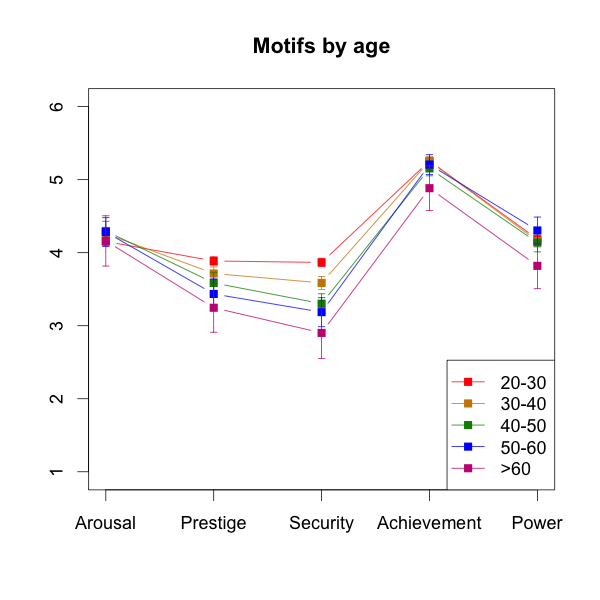
The graph (click to enlarge) shows that the variable age is related to the motifs prestige and security. The older the participant is, the lower (s)he rates on these two scales. Thus, younger people (in our sample) have higher motifs of prestige and security than older people. Statistical analysis reveals a strong evidence of these findings with effect sizes of eta=0.87 for security and eta=0.55 for prestige. All numerical results are summarized in table 1. The other three motifs – arousal, achievement and power – prove not to dependent on the age of the participant.
Overall, people seem to relax more when they get older.
Expertise
In the graphic you can see a slight difference between expertise on the motifs arousal and power. People with lower expertise seem to have higher motifs for being aroused and having power.This result is contradictory to the expectation. On the one hand people who intend to have a lot of power could see themselves not as much as experts as they do need more experience (or power) to feel powerful over the computer.
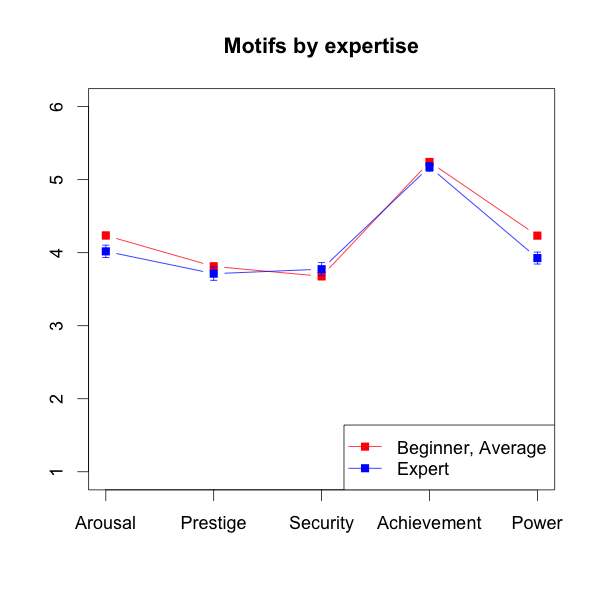
Summing it up, we believe the question does not work out. People find it difficult to estimate their own expertise and, more relevant, no one wants to be a beginner. Therefore questions of this kind should not be used in general and will more specifically be excluded from further inspection of our data.
Relevance
Relevance describes whether people consider working on a computer more or less important. It turns out to take a strong effect on all motifs except for security. Detailed statistical analysis prove the strongest effects for achievement (eta=0.85) and power (eta=0.68). The direction of this effect is the same for all four motifs: People for whom working with computers is more important show lower ratings on the motifs.
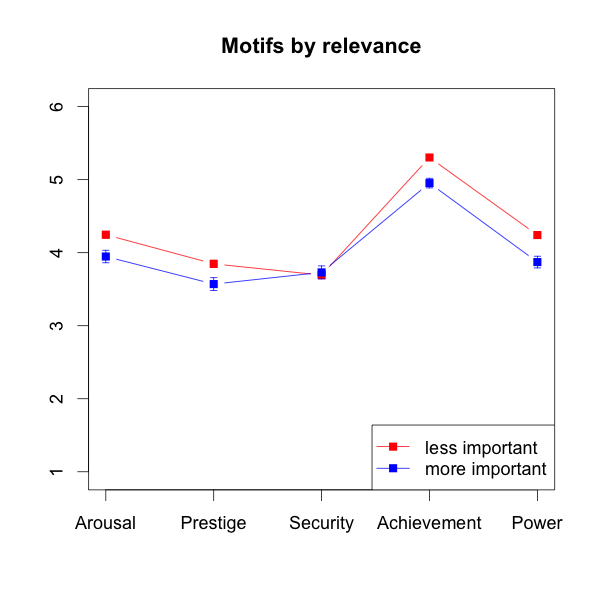
Again, this is actually a very debatable finding. Do people need lower motives to allow or at least report computer to be important for their lives? Again, we believe this kind of question does not work out in a user survey and thus the data is excluded from further inspection.
Usage
The time spent on the computer shows a slight effect on achievement, power and arousal. People who spend less time using a computer report higher values on these motifs (comparable to expertise).
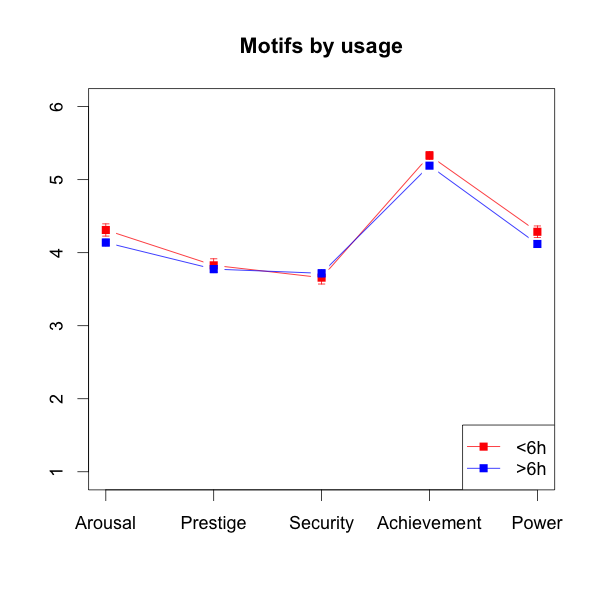
These effects are not strong (eta < 0.3). Further investigations on the effect of usage on other constructs also proves this variable to be irrelevant. This shows that the time people spend in front of a computer does take a relevant influence. This result should be obvious: You can spend a lot of time playing, reading e-mails or just surfing the web, without gaining any expertise in how a computer works. This variable will therefore be excluded from further investigations.
Statistical Analysis
Statistical analysis were computed as linear regression respectively ANOVA between motifs and independent variables. Based on resulting F-value the effect size ‚eta‘ was calculated to estimate the relevance of a finding. The explained variance is eta². For example the relation between security and age reveals 76% of the overall variance. All calculations (and graphics) were conducted using R.
Table 1: Statistical analysis of motifs. Red color shows significant results. Eta denotes the effect size.
| Test | F | df | eta | p |
| Security~Age | 112.82 | 3997 | 0.872 | 0 |
| Achievement~Relevance | 103.77 | 4295 | 0.846 | 0 |
| Power~Relevance | 60.25 | 4292 | 0.677 | 0 |
| Power~Expertise | 44.56 | 4296 | 0.562 | 0 |
| Prestige~Age | 41.27 | 3997 | 0.547 | 0 |
| Arousal~Relevance | 35.28 | 4299 | 0.474 | 0 |
| Prestige~Relevance | 27.04 | 4296 | 0.381 | 0 |
| Arousal~Expertise | 20.02 | 4302 | 0.292 | 0 |
| Achievement~Usage | 18.07 | 4304 | 0.266 | 0 |
| Power~Usage | 13.66 | 4302 | 0.204 | 0 |
| Arousal~Usage | 13.06 | 4308 | 0.195 | 0 |
| Achievement~Age | 7.5 | 3993 | 0.118 | 0.006 |
| Arousal~Age | 4.47 | 3998 | 0.071 | 0.034 |
| Achievement~Expertise | 4.15 | 4298 | 0.063 | 0.042 |
| Prestige~Expertise | 3.72 | 4299 | 0.057 | 0.054 |
| Security~Expertise | 3.61 | 4300 | 0.055 | 0.057 |
| Security~Usage | 1.41 | 4306 | 0.022 | 0.235 |
| Prestige~Usage | 1.05 | 4305 | 0.016 | 0.307 |
| Power~Age | 0.57 | 3994 | 0.009 | 0.452 |
| Security~Relevance | 0.48 | 4297 | 0.007 | 0.486 |
Last but not least, it is worth to mention – as you can see in all of the graphs – that our sample in general rates above average on all motifs, but especially on achievement. This does not necessarily mean that all of our participants are extremely ambitious. We rather assume the question we chose to assess achievement has been formulated a little too strong. Because of the ceiling effect we decided to exclude this motif from further investigations. We will modify this question in future surveys, in order to move the results more towards the middle of the scale.
Relations between Motifs
In the next step of our analysis, we conducted an analysis of configurational frequencies (CFA). The idea of a CFA is to compare the expected frequency of a certain combination of factors with the actually observed frequency. This way we are able to identify patterns in the data that occur significantly more often (they are called ‚types‘) and such that occur less often (they are called ‚antitypes‘).
In order to do so, we dichotomized the remaining four motifs by average (marked as + for above and − below average values in the following table) for the calculations. Although motif dimensions are assumed as independent, the question we are trying to answer in the context of motifs is: Do people’s answers show any patterns? A pattern could be something like: high arousal often goes along with low prestige.
The results, as shown in table 2, reveal combinations that characterize about 6% of the population each in average. The deviation from that average is about ±5%. The data thus proves to be suited for a CFA.
In theory the motifs are considered to be independent from each other. The results however show types of low-raters (−−−−) and high-raters (++++). To explain these findings, we assume some people did not answer the motif questions honestly, but clicked constantly on the left- or right-hand side. As the motif questions feel very personal, this behavior is not too surprising. The following significant antitypes are a consequence of the two strong types.
Summing it up, we expect some unwanted variance in the motifs, which might superimpose other effects in follow-up examinations. But we are confident to have assessed the motifs in a sane way and to be able to continue to work with them.
Table 2: Analysis of configurational frequencies. Minus denotes values below, plus above median. Red color shows significant results.
| Aro. | Pre. | Sec. | Pow. | n | expected | n-exp | chisq | p.chisq |
| − | − | − | − | 357 | 217.0252 | 139.97 | 90.28 | 0 |
| + | + | + | + | 435 | 301.2024 | 133.8 | 59.43 | 0 |
| − | + | − | − | 207 | 334.0134 | -127.01 | 48.3 | 0 |
| + | − | + | + | 112 | 195.7063 | -83.71 | 35.8 | 0 |
| + | − | + | − | 178 | 259.4567 | -81.46 | 25.57 | 0 |
| − | + | − | + | 180 | 251.9439 | -71.94 | 20.54 | 0 |
| − | − | + | + | 165 | 224.6019 | -59.6 | 15.82 | 0 |
| − | − | + | – | 360 | 297.7649 | 62.24 | 13.01 | 0 |
| + | + | − | + | 271 | 219.5307 | 51.47 | 12.07 | 0.001 |
| + | − | − | − | 227 | 189.1044 | 37.9 | 7.59 | 0.006 |
| + | + | + | − | 346 | 399.3177 | -53.32 | 7.12 | 0.008 |
| − | + | + | + | 391 | 345.6742 | 45.33 | 5.94 | 0.015 |
| − | − | − | + | 138 | 163.7006 | -25.7 | 4.03 | 0.045 |
| − | + | + | − | 495 | 458.276 | 36.72 | 2.94 | 0.086 |
| + | + | − | − | 276 | 291.0418 | -15.04 | 0.78 | 0.378 |
| + | − | − | + | 153 | 142.6401 | 10.36 | 0.75 | 0.386 |
In the next post we will reveal our findings about the usage of LibreOffice tools.
References
[1]: Cooper, A. (1999). The Inmates Are Running the Asylum. Sams: Indianapolis.
[2]: Bischof, N. (1975). A systems approach toward the functional connections of attachment and fear. Child Development, 46(4), 801-817.