
Introduction
Earlier this year we run a survey on LibreOffice Calc. It was inspired by a similar questionnaire for LibreOffice Draw (see first and second blog post). The Calc survey was used to learn about how Calc is being used, what features are most important to users and where they expect to see the improvements to the software. The work was done by Maria Berg, thanks a lot for your contribution.
This blog post shows some results in detail. You may also see the slides or watch the recording of the presentation at the LibreOffice conference.
Demographics
In total 1797 people started the survey and 1229 completed all questions. Many thanks to everyone!
We started with a couple of demographic questions that demonstrated the limits of online surveys: most participants were middle age (65% between 33 and 65 years old), technology-affine (60% use Linux as operating system), and power users (45% run the application every day). We advertised the survey on our blog and social media such as Twitter (you may also follow the design team), Reddit, and Facebook. And while LibreOffice has roughly 200 millions users, most of those who are following us are technology enthusiastic.
The results should may be taken with a grain of salt, but on the other hand: Why not trust the experts?
Usage
What other data related software do you use?
To understand how Calc is positioned, we asked what other software is used and started with a couple of well-known tools. Unsurprisingly, Microsoft Excel comes first with about 50%, followed by Google Sheets with 33%, R with 9%, and Gnumeric with 3%. Quite interesting is what comes in mind when asked “What else?”. We list the replies categorized and sorted by the number of mentions:
- Office: OnlyOffice, WPS Office, OpenOffice, Collabora Online, Zoho Sheet, Softmaker, IBM Symphony, MS Office from 1990, Quattro Pro
- Code: Python (numpy, Pandas), Matlab, GNU Octave, command line tools and editors
- Database: SQL, LibreOffice Base, Ninox, Microsoft Access
- Cleanup: OpenRefine, Root
- Collaboration: Airtable, Cryptpad, OX Drive, Framacalc
- Statistical: Stata, Jamovi, Cogstat, Alteryx, JASP, GNU PSPP, Sofastat, Minitab, JMP
- Plotting: Microsoft PowerBI, Veusz, GnuPlot, LabPlot, Graphpad Prism
Some other tools for special scenarios such as GnuCash are omitted here.
How large is your typical LibreOffice Calc document?
This question was deliberately asked openly to get a better understanding of how users think about size. Most participants referred to document size in row/columns. Most commonly mentioned sizes were up to 5 sheet with 1000 rows and 25 columns. Some users mentioned their document sizes to contain up to millions of rows, 1000 columns and 100 sheets. Some participants referred to their documents in bytes of around 5MB (up to 1GB).
Which types of functions have you used recently?
LibreOffice Calc provides a vast amount of functions. Since asking about any single function is not possible, we used categories with a few examples.

While the distribution is not too surprising, it’s worth to mention that about 20% of surveyed participants use statistical functions and 10% database functions. Our community clearly has many advanced users.
How important or unimportant to you are the following LibreOffice Calc features?
To dig deeper into the topic we asked about specific features. The participants were asked to reply to a Likert scale between 1 “not important at all” and 5 “very important”. To avoid bias that may have been produced by people responding “unimportant” to features that are unknown them, we’ve included “not familiar with the feature” as a potential answer choice. The graph shows these answers as gray bars in percent (100 minus the value). For example, Scenarios are unknown to about 50% of surveyed participants. The graph shows sorted Likert responses with the most important features on the top (the percentage of positive responses is shown on the right, negative on the left).
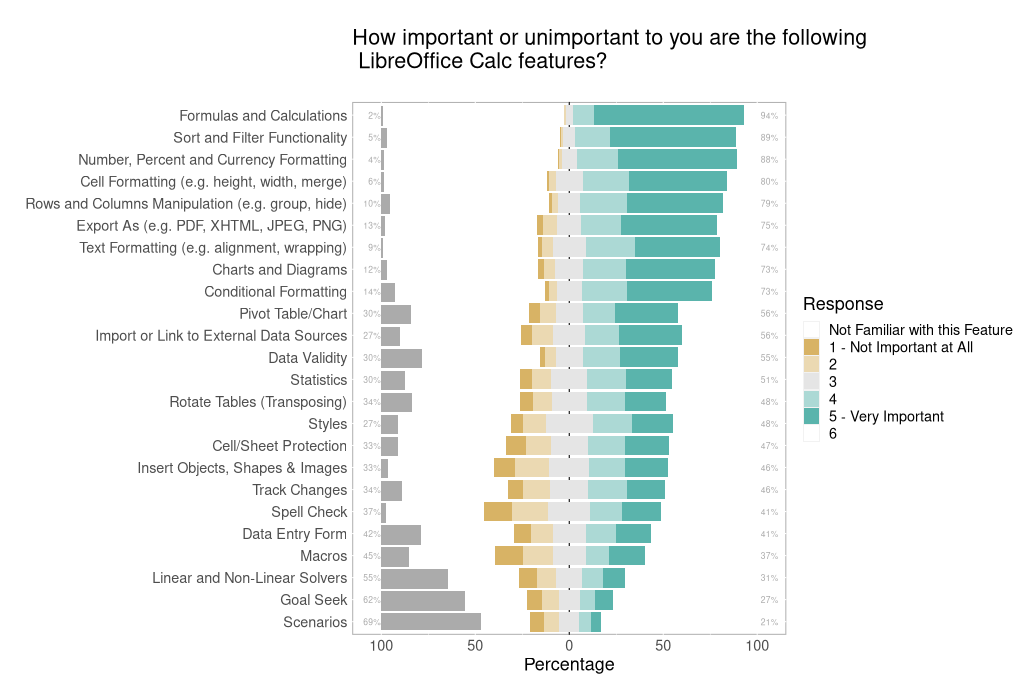
Of course, formulas and calculations as well as sort and filter are essential features for any spreadsheet tool. Not so clear is the rating of formatting features, in particular the text formatting. Many users obviously process data for presentations or use the table to structure their content.
The most interesting result is revealed by comparing importance and familiarity. Some features, such as pivot tables, have a significant number of people who are not familiar with them, but are rated as highly important by people who are are familiar with those features. Other examples include data validity and transpose features, styles, conditional formatting as well as statistics. These features would surely be missed by people who are familiar with them.
What do you mainly do in LibreOffice Calc?
Usability always starts with scenarios and we wanted to know what LibreOffice Calc is being used for. The results reveal two main categories: to load and inspect structured data and to store small data sets.
Load and inspect data
Users load structured data, primarily CSV, first of all in order to inspect the content. Manipulation of data such as transposition and pivoting, aggregating, formatting and visualization follows. Some exemplary answers:
- “Viewing and exploring CSVs before importing into R”
- “Import csv or fixed width text files. Turn into a nice format to upload to Google Sheets where I share/collaborate”.
Store small data sets
Business accounting and household budgeting were reported most often. Project planning and time tracking is also done with the help of LibreOffice Calc. Users keep track of personal data such as fuel and gas/water/electricity consumption, store biometric data like blood pressure or weight, and manage their medication. Many people collect addresses and inventory and organize shopping- and wish lists. Some examples:
- “Keeping track of my economic situation, battery charging and other costs for my electric moped and a lot more. I even made a few simple games that I play now and then.”
- “I use it as a lazy alternative to a database: I track CDs and books. I also have a spreadsheet where I track some basic biometric numbers over time (weight, cholesterol, etc).”
- “…tracking monthly electric bills, with data and graphs to see the trending; registering cars/motorcyles yearly insurance and registration dates, with alerts when due; daily health recordings, with graphical tracking…”
Advanced calculations
Beyond these most common use cases some comments reveal alternative uses of Calc and show the true power of LibreOffice. The charts and graphs are not only used for data inspection, but are also used in education as a tool to illustrate distributions. Users use Calc to run statistical analysis and do financial modeling. The tabular organization of cells can even be used to represent a floor plan.
- “I plot charts related to data distribution as well as control charts and use statistics-related functions to analyze data. I also use the solver to solve linear programming problems… I also use LO Calc for general data analysis by creating tables and auto-filters.”
- “I build forecasting models for various companies for reporting or including in PPMs and other financial instruments. I also build models for statistical analysis of financial data. Another type of model I have been building is the KPI dashboards.”
- “…as a topographical site/floor map for a local farmers market: Cells are populated weekly with incoming vendors and distributed to staff.”
Improvements & Expectations
The responses to “In your opinion, which LibreOffice Calc feature[s] (if any) need improvements the most?” boil down to six categories:
Usability & User Experience
Users expect better usability, improvements to the UI and a modern design in general, better styles and formatting. Users want Notebookbars to shine, expect better icons, and wish to see a dark mode.
- “I always have a hard time dragging cells. You have to be very precise with the cursor so I usually give up and use copy paste.”
- “Applying paragraph or character styles to the contents of a cell. The ability to have bullets/lists would be great.”
- “Improve Interface and usability, the ribbon needs to be improved with most used functions.”
Compatibility
Better compatibility with other file formats in particular Microsoft Excel is desired, as well as an improved connectivity to external data sources, and better default keyboard shortcuts.
- “Copying/Cutting/Moving of cells/columns/rows should be simplified, keyboard shortcuts should be improved”
- “Removing duplicates from a dataset is much more cumbersome than in Excel.”
- “The solver needs to store the objective function and limiting conditions when the spreadsheet is saved.”
- “I have stopped using Calc for Google Sheets due to it’s lack of web data source support.”
Performance & Stability
Speed and performance improvements are needed for large datasets. Users also expect developers to work on stability and to fix bugs.
- “I appreciate the speed improvements that have been made through previous updates. Please continue.”
- “When manipulating large spreadsheets (20+ worksheets, 50000+ rows and 100+ columns per sheet), CALC quickly becomes unresponsive if there are many lookup formulas.”
Functions
Introducing a smooth scrolling on large rows was mentioned a couple of times. The ability to use more columns is expected as well as better handling of charts. Greater variety of chart types are also desired. The formula and functions wizards have room for improvement. The autocomplete feature and conditional formatting also need improvements, and last but not least users ask for collaboration features.
- “Scrolling – provide an option to scroll without snapping to cell grid.”
- “The wizard to create chart is so hard to understand. Should be redesigned from scratch!”
- “Improve the function wizard to show intermediate results and also allow the user to step through a formula like Excel does, showing the intermediate result of every step.”
- “Pivot tables need to be user friendly to manipulate data easier.”
- “Conditional formatting is not very stable and cannot be copied and pasted.”
Macros
Improvements for macros, including a macro recorder, and programming in general with focus on Python, are expected.
Documentation & Help
Users want to be able to find the features they need with ease. They also want a better learnability, and ask for more help and documentation.
- A lot of the information, especially for non-trivial things… is not detailed enough, or is obsolete, or is hidden.
General Usability
Last but not least we wanted to know how well LibreOffice Calc performs on a standard usability test. This System Usabiliy Scale (SUS) is widely used in industry and produces results that are easy to compare. The test consists of a couple of simple questions and is more suited for websites and mobile apps than complex applications, where one aspect might be easy to use while others are designed for experts, but the rating is interesting anyway.
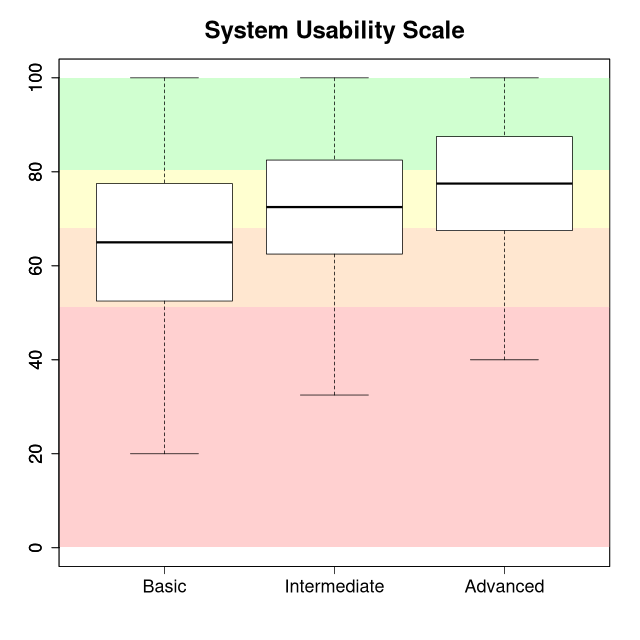
The average SUS score for Calc of 71.4 would be considered as an above average score (previously research studies on other software reported an average SUS score of 68). The SUS score is higher for advanced users who work with the application for many years (and are older). New, younger, and (self-estimated) basic users appear to be less happy with the application.
Conclusion
In our development we focus on two kind of users: people who run the application occasionally and just want to get a simple task done with no frills and the advanced experts who tend to try all software features. This assumption has proven to be correct again in this survey, even after taking into account the fact that the sample we’ve used is not representative.
While working on Calc, we have to continue to accommodate both beginners and experts. First of all, we need to simplify most common user tasks. That might be an overhaul of wizards, more straight-forward interactions with the sidebar, or shortcuts to frequently used workflows. As the design team, we will pick up requests from the bugtracker, prioritized on the outcome of this survey, collect all the requirements into user stories, and draft mockups for an improved workflow. You are very welcome to join this effort. However, what’s also required are improvements to existing functions where stability and performance come first. If you are a student you might be interested in participating in the Google Summer of Code next year.
Another important field where effort is needed is the documentation. Some features are crucial for users but unknown to many. To make the work with LibreOffice a pleasure for everyone it is essential to support and educate new users. Join the documentation team and assist us with writing help articles or spread the word with how-to guides on your own personal blogs. You can also write a new Tip-of-the-Day and illustrate it with pictures or an animated GIFs. Becoming involved is possible for everyone.
Interesting data! Thank yoy for sharing!
I think a lot of people just want the functionality, compatibility and interface of Microsoft Excel. By any measure the leading Office suite world wide.
The over representation of Linux users is a serious issue with this survey as they are very likely to be more advanced than a Windows user that downloads the software to accomplish tasks.
This skews the results away from the requirements and expectations of by FAR the largest user group of LibreOffice.
Interesting nothing about XLOOKUP or some of the new array formulas etc. Some of the new Excel formulas became a game changer for me as soon as the people I worked with also had them. Unfortunately I suspect to get the new array formulas to work in Calc will require a major rewrite.
Xlookup was requested 2x at future improvements and 4x at expected features. Follow https://bugs.documentfoundation.org/show_bug.cgi?id=127293 to keep updated.
In wonder how many respondents mentioned that Calc finally needs to handle more than 1024 columns?
Unfortunately I frequently crash this Calc limit and need to switch to Gnumeric or Excel (which both handle up to 16384 columns).
More than 1024 columns was mentioned 3x at improvements and 3x at expected features (only 1 at both questions). So in total 5 people are asking for this (I searched for “1024”; something like “allow more columns” would have been slipped through). The enhancement request in https://bugs.documentfoundation.org/show_bug.cgi?id=50916 is quite old and has a high priority due to many duplicates and people on the CC list..
More than 1024 columns was mentioned 3x at improvements and 3x at expected features (only 1 at both questions). So in total 5 people are asking for this (I searched for “1024”; something like “allow more columns” would have been slipped through). The enhancement request in https://bugs.documentfoundation.org/show_bug.cgi?id=50916 is quite old and has a high priority due to many duplicates and people on the CC list..
You may have missed a lot of people in your audience who want to use LibreOffice, but who give up at the first, second, third hurdle.
As Google Sheets continues to pickup users, there are those of us who want to move away from the platform to something opensource, but a lack of certain functions (eg filter() ) makes this near impossible because current implementations in Calc are very manual, or, very very complicated to implement.
You make a wonderful product and your intentions are beyond noble. It is not my intention to come over as ass-hat, rather to provide (at the very least) a missing data point or hopefully point to lots more data points that could make the software better,