
Probably everyone working with Libreoffice Calc is using charts. And maybe some wondered why the dialog to insert a chart has a wizard-like workflow for all the less relevant options. But inserting a chart is not only a task in Calc. You can add charts in any other tool. And then things really get messy…
This article was posted first on 2015-Apr-16 at user-prompt.com (site closed now)
Topic: Inserting a Chart
Big Tickets/Feature Requests:
Issue/Problem
- For experienced people the wizard distracts from the workflow
- Programs need to have a unique access (Writer inserts chart immediately, Calc shows up a wizard…)
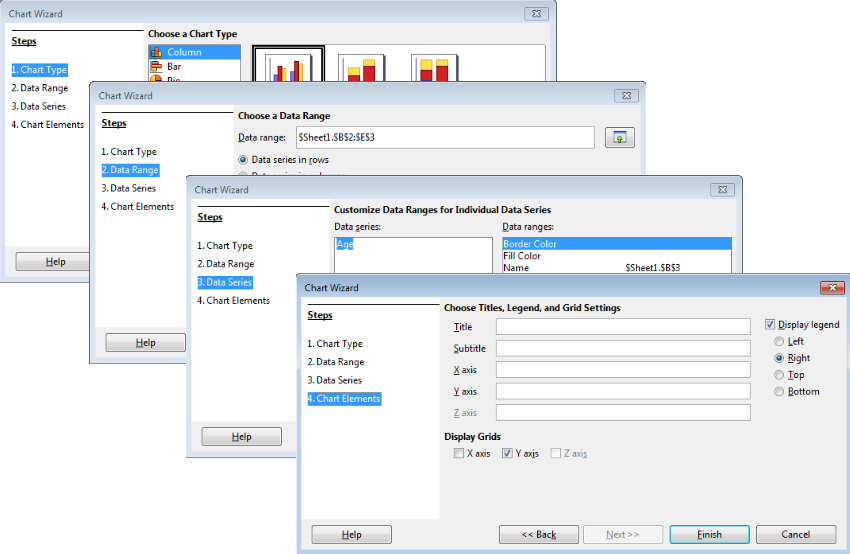
- Current wizard-style dialog is using rather a tabbed setup
- Steps are not naturally implemented (first, the range is selected and then the type of chart)
- Dialog appears in a wizard-style which isn’t necessary or easy
Screenshots of current UI
Features/Functional Requirements
- Selection of chart type and subtype
- (Re-)definition of data range
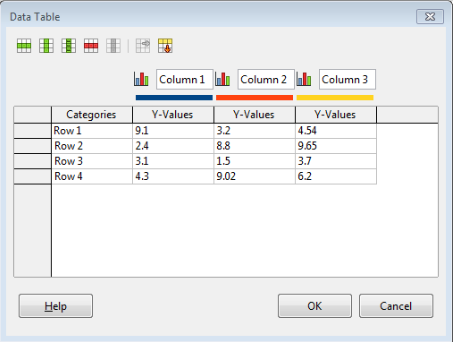
- Access to user-defined data table in Writer
Heuristics/Nonfunctional Requirements
- Use of a styleguide (accordion instead of linked list, for instance)
New design/Mockup
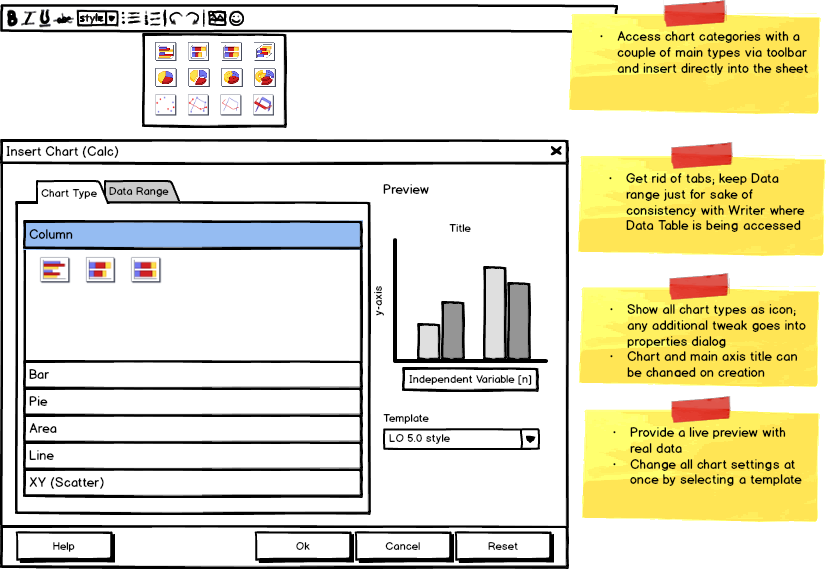
- Apply accordion style since users liked it in the last proposals
- Simplify as much as possible; options that can be tweaked afterwards
- x and y-axis,
- wall (chart inside area),
- area (chart outside area),
- data series, legend) plus
- special dialogs like error bars;
- titles are configured on the respective dialog
- Data range and chart type are not accessible anymore after creation (one has to recreate the chart from scratch)
- Have a real preview rather than the preview inside of the document
- Provide direct access to insert chart from toolbar split/group buttons
- Special chart customization options (e.g. stack series for Line chart type) previously accessible at creation should be moved into the properties dialog (see illustrations below)
- Make charts themable by templates that allow to changes all properties at once (e.g. according company branding)

- Use the same dialog over all tools/modules
- Change data range to data table for non-Calc modules for insert values
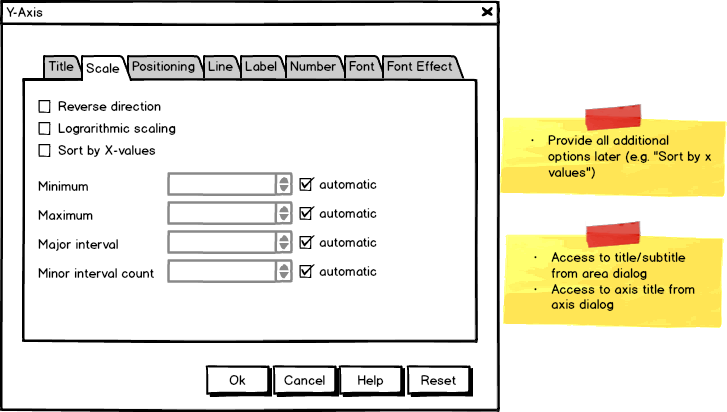
- Properties that formerly were configured on chart creation needs to go into the properties dialog (e.g. sort by x-values)
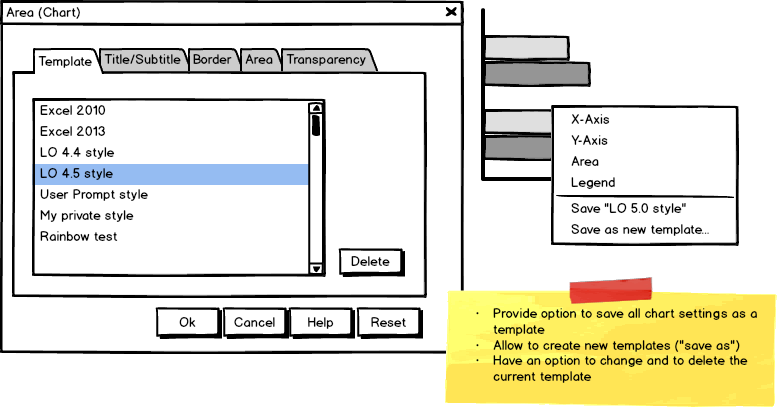
- Provide access to save current style or save under a new name (with a small dialog) with the context menu; option is available with any context
- In order to allow to delete a self-made template or to switch to another existing have a new tab on the most generic dialog, the chart area
- Changing a template invokes the new style immediately but makes it effective after Ok, i.e. Cancel revokes the old style
Alternative layout
Since accordions are just one way of interaction we want to show you as well other options how to deal with large lists in future. The alternative layout has a continuous scroll area therefore with section headers. Furthermore the workflow is slightly different as you do not theme the complete chart by a template but have separate access to style and layout.
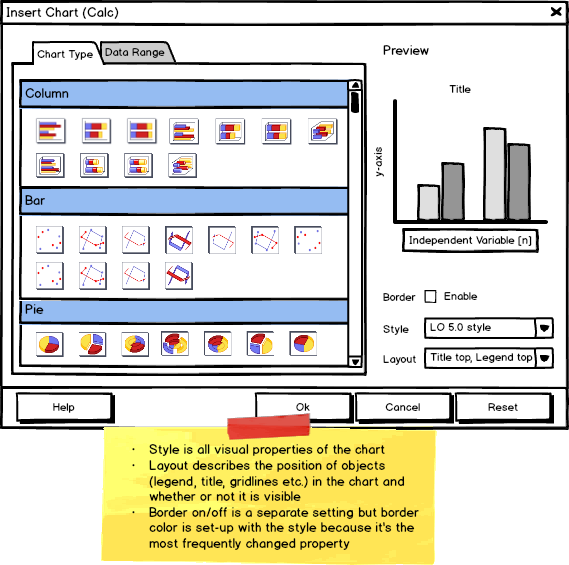
- Templates might be too generic; users want to have a few options to style the graph and to have a specific layout which are different processing steps that must not aggregated into one template
- Chart type, data range, data table would be accessible after insertion in a ‘Chart’ dialog which combines other dialogs (chart type, chart area, chart wall, chart floor, data range, data table, 3d view) into one.
Conclusion
We show some mockups how to replace the current Insert Chart dialog with a lot of unnecessary options by a streamlined dialog plus quick access from the toolbar. People asked why we don’t just add the chart and get rid of the dialog at all. Options could be presented in the sidebar. The answer is, dialog functionality is the base level of interaction, while the sidebar gives quick access to modify properties but never replaces dialogs. Additionally the inserted chart is an OLE object which means we do not have access to its properties unless the edit mode is being activated.
About the interaction alternatives: the first option consists of an accordion which would show one section only at once. The alternative layout uses a large scrollarea with section headers to structure the content. Which of the two options do you like best?
And the alternative layout separates the template to theme the complete chart into style and layout. What is your preference here?